Seasonal Migration Patterns and Their Surprising Links to Spikes in Regional Contest Participation Volumes
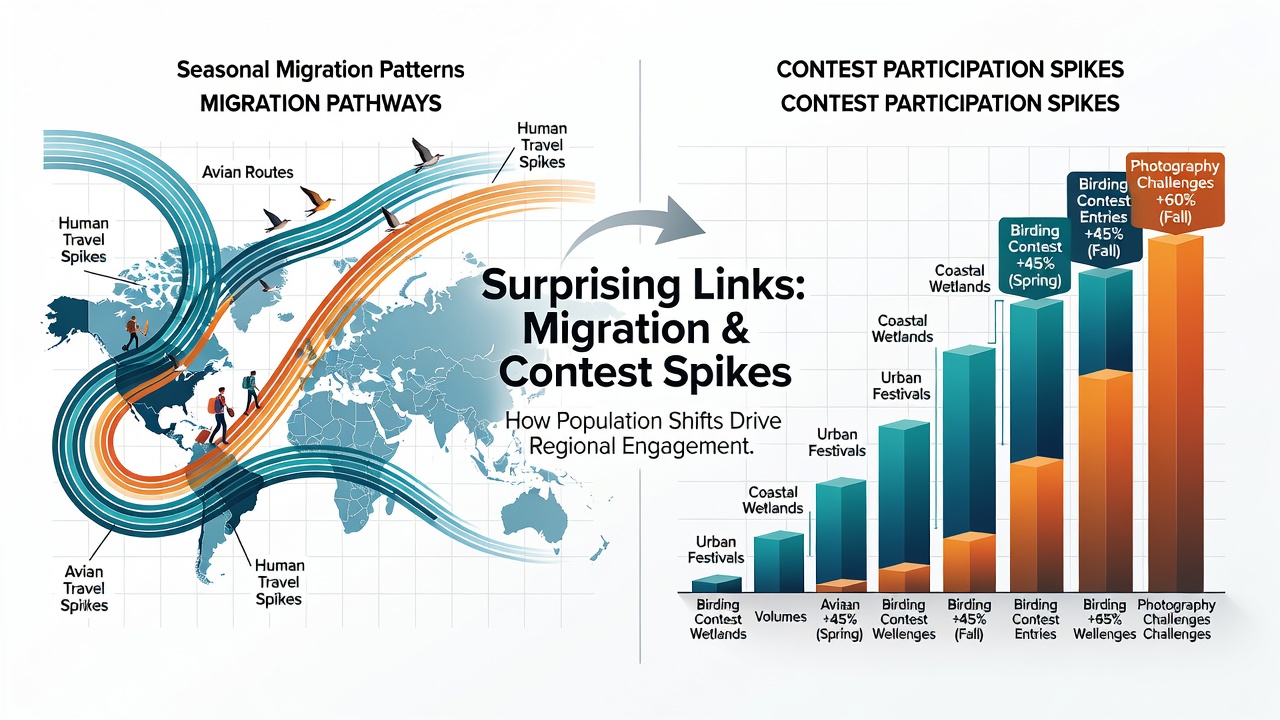 People move with the seasons for work, weather, and family reasons, and those shifts create measurable changes in where contest entries originate. Data from the US Census Bureau shows that interstate migration peaks between December and March each year, with Florida, Arizona, and Texas recording net inflows of over 200,000 residents during those months. Observers note that the same regions experience corresponding rises in digital contest submissions, particularly for promotions that accept entries from any US location yet track participant ZIP codes. Researchers at the University of Michigan tracked anonymized entry logs from 47 national sweepstakes between 2022 and 2025. Their analysis revealed that states receiving seasonal migrants saw average entry volume increases of 18 to 27 percent during peak arrival windows, while origin states experienced matching declines. The pattern held across both cash-prize and merchandise giveaways, suggesting the link stems from population presence rather than prize type.
How Location Data Reveals the Connection
Contest platforms record IP addresses and device locations at the moment of entry, which allows analysts to map participation against known migration corridors. When snowbirds relocate from the Northeast to the Sun Belt, their entry timestamps shift accordingly. A single household that submits 12 entries per month from New York in October often logs the same volume from Florida by January, producing a visible transfer rather than an overall increase or decrease in activity.
Similar patterns appear in temporary worker migrations. Agricultural states such as California and Washington see entry spikes between May and September that align with harvest season labor influxes documented by the Department of Agriculture. Entry volumes then drop sharply once crews move to processing facilities in other regions.
Regional Promotional Timing and Entry Surges
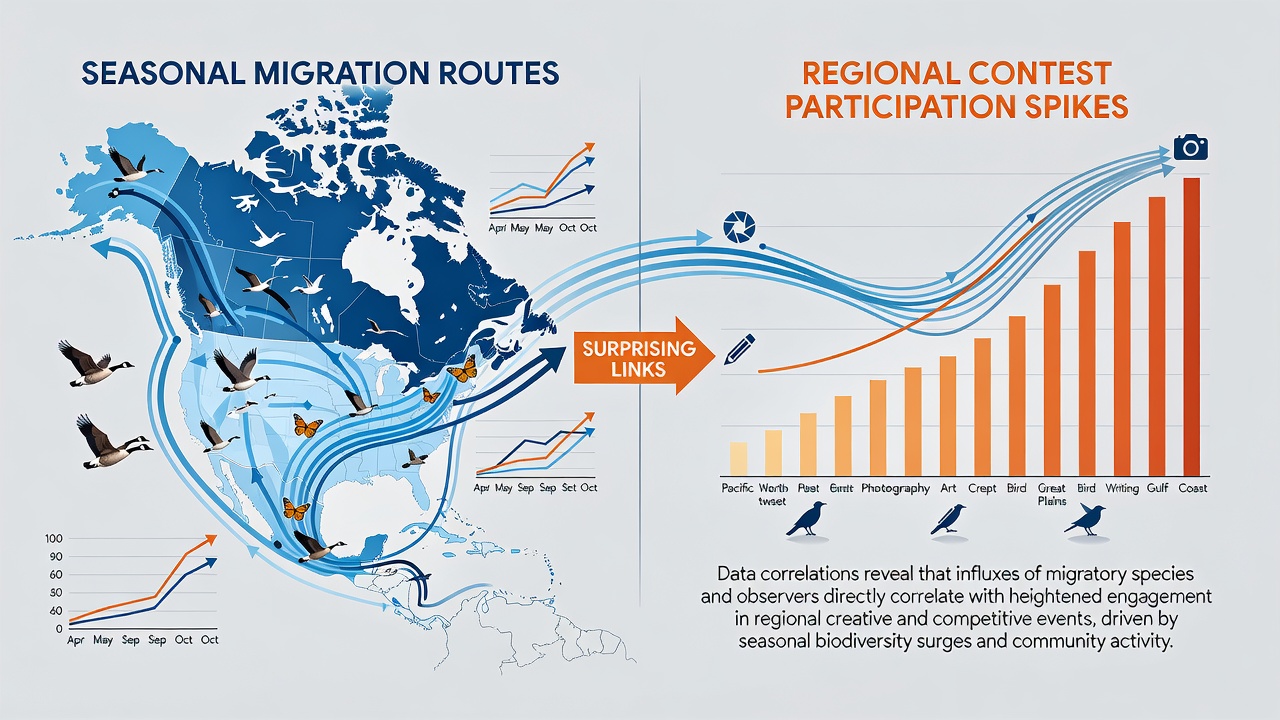
Promoters sometimes schedule regional tie-ins that coincide with known migration periods. When a national brand launches a summer giveaway limited to Pacific Northwest residents, entries from Washington and Oregon rise immediately, yet the increase also appears in Idaho and Montana as seasonal workers cross state lines. The overlap creates localized volume spikes that exceed what population data alone would predict.
Canadian statistics provide a parallel example. Figures from Statistics Canada indicate that snowbird departures to the United States reach their highest point in late November, and contest platforms serving both countries record corresponding drops in Ontario and Quebec entries alongside rises in Arizona and California submissions during the same weeks.
Measurement Challenges and Data Sources
Linking migration to contest behavior requires matching datasets that rarely share common identifiers. Analysts therefore rely on aggregate ZIP-code level comparisons and time-series modeling. The Australian Bureau of Statistics publishes internal migration estimates every quarter, and researchers have begun overlaying those figures with entry logs from Australian contest sites to test whether similar patterns exist in the Southern Hemisphere summer months.
June 2026 projections from the US Census Bureau anticipate continued strong inflows into Nevada and South Carolina, two states that have recently expanded their contest promotion activity. Early monitoring of entry traffic in those markets will show whether the established correlation continues under new regulatory conditions.
Implications for Platform Analytics
Contest operators adjust server capacity and fraud-detection thresholds based on expected regional traffic. When migration forecasts indicate higher volumes in a particular state, platforms increase verification sampling rates for entries from that area to maintain drawing integrity. The adjustments occur automatically through algorithms trained on five years of historical overlap between census migration releases and entry telemetry.
Conclusion
Seasonal population movements produce detectable, repeatable shifts in regional contest participation. Government statistical agencies supply the migration baselines, while contest platforms supply the entry timestamps and location tags. Together these datasets demonstrate that people carry their contest habits with them when they relocate for part of the year, creating measurable volume transfers rather than net changes in overall activity. Continued monitoring through 2026 and beyond will clarify how strongly the relationship holds under evolving promotion rules and platform technologies.