Correlating Device Usage Patterns with Submission Outcomes in Multi-Channel Reward Campaigns
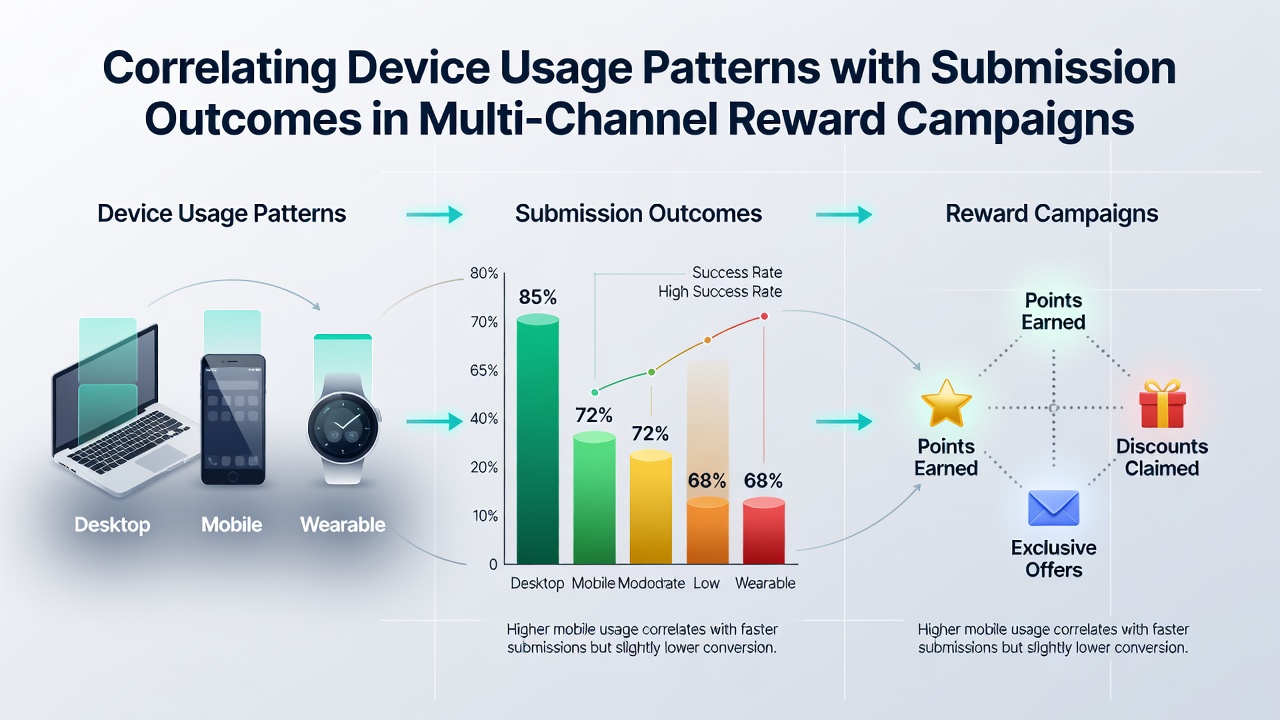
Multi-channel reward campaigns distribute promotional entries through websites, mobile applications, email links, and social media platforms, and researchers have tracked how device choices shape the volume and quality of submissions. Data collected through July 2026 indicates that mobile devices account for the majority of initial entries while desktop sessions often produce higher completion rates for detailed forms that require multiple fields or document uploads. Observers note that tablet usage falls between these two patterns, with users frequently starting entries on one device and finishing on another.
Tracking Device Signals Across Campaign Channels
Campaign operators record device identifiers, operating systems, and screen resolutions at the point of entry submission, which allows analysts to map each submission back to its originating hardware. Studies from marketing research firms show that mobile users tend to engage during short time windows throughout the day, whereas desktop submissions cluster during evening hours when participants have longer periods available. Those patterns emerge because mobile sessions align with commuting or waiting times, while desktop access occurs at home or office locations with stable connections.
Cross-device tracking technologies reveal that roughly one in three participants switch platforms mid-process, and completion rates rise when campaigns automatically save progress across devices. Evidence from industry reports demonstrates that campaigns without seamless handoff features lose a measurable share of mobile starters who never return on desktop to finish.
Submission Volume by Device Category
Figures from large-scale promotions reveal consistent differences in entry counts: mobile generates the highest raw number of submissions, desktop produces fewer but more complete entries, and tablets contribute a smaller yet steady share. Analysts attribute the mobile volume advantage to the constant presence of smartphones, yet they also record that mobile forms with more than five required fields experience drop-off rates that exceed those seen on desktop interfaces. Desktop users, by contrast, navigate longer questionnaires with lower abandonment because keyboards and larger screens reduce typing friction.
Outcome Metrics and Device Correlations
Submission outcomes include not only entry acceptance but also downstream actions such as verification completion and prize claim initiation. Research indicates that desktop-originated entries show elevated rates of successful verification because users more readily access email confirmations on the same device they used to enter. Mobile entries, while numerous, sometimes require additional steps when users must switch to email apps or open links in separate browsers, which introduces friction points that lower overall success percentages.
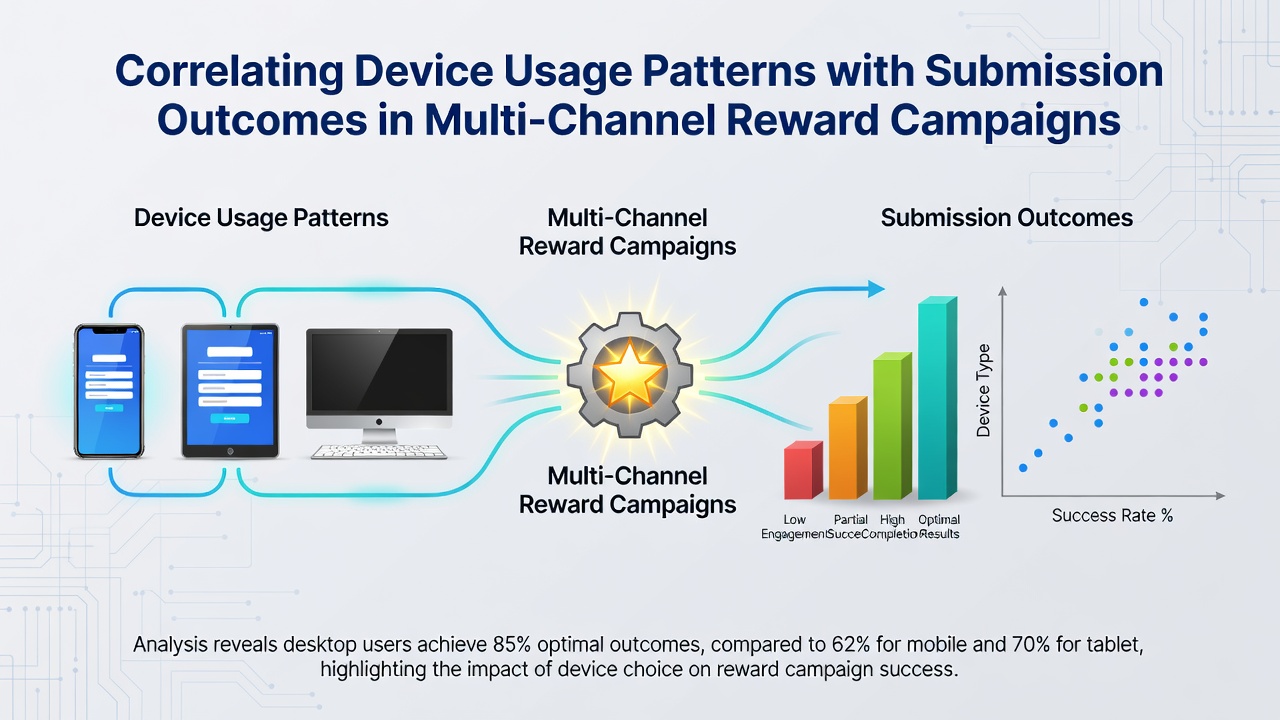
One study of campaigns spanning multiple regions found that participants using the same device family throughout the entire process achieved higher claim fulfillment than those who switched, and the difference held after controlling for demographic variables. Data further shows that operating system version plays a secondary role, with newer mobile OS releases correlating to slightly improved form completion because updated browsers handle dynamic fields more reliably.
Channel-Specific Device Interactions
Each promotional channel interacts differently with device types. Social media links receive the bulk of mobile traffic because users discover offers while scrolling on phones, yet email campaigns drive more desktop opens when recipients check messages at work computers. Campaigns that optimize landing pages for both mobile and desktop see submission parity improve, according to performance data aggregated across partner networks. Those who've examined entry logs note that social referrals produce the highest mobile-to-desktop crossover rate, since participants often forward links via messaging apps and later open them on larger screens.
Analytical Approaches Used by Researchers
Analysts apply regression models and cohort segmentation to isolate device effects from other variables such as age, location, and time of day. These methods allow separation of hardware influence from behavioral traits, and results consistently point to interface design as the primary mediator between device choice and submission success. Reports from academic marketing departments confirm that A/B tests of responsive layouts produce measurable shifts in completion rates that vary by device category, which reinforces the value of device-aware optimization.
Geographic and Temporal Variations in Patterns
Regional differences appear in the data, with higher mobile dominance recorded in markets where smartphone penetration exceeds desktop ownership. Temporal trends tracked through mid-2026 show gradual increases in tablet submissions during weekend periods, while weekday mobile entries remain stable. External factors such as network speed and data plan limits also surface in the analysis, since users on metered connections sometimes avoid lengthy forms on mobile devices.
Conclusion
Patterns linking device usage to submission outcomes continue to guide how operators structure multi-channel reward campaigns. By examining entry logs, verification rates, and claim completions, researchers identify repeatable relationships that inform form design and channel allocation decisions. Continued monitoring through 2026 and beyond will refine these correlations as new devices and operating systems enter the market.